PCYM: Pattern Centric Yield Manager

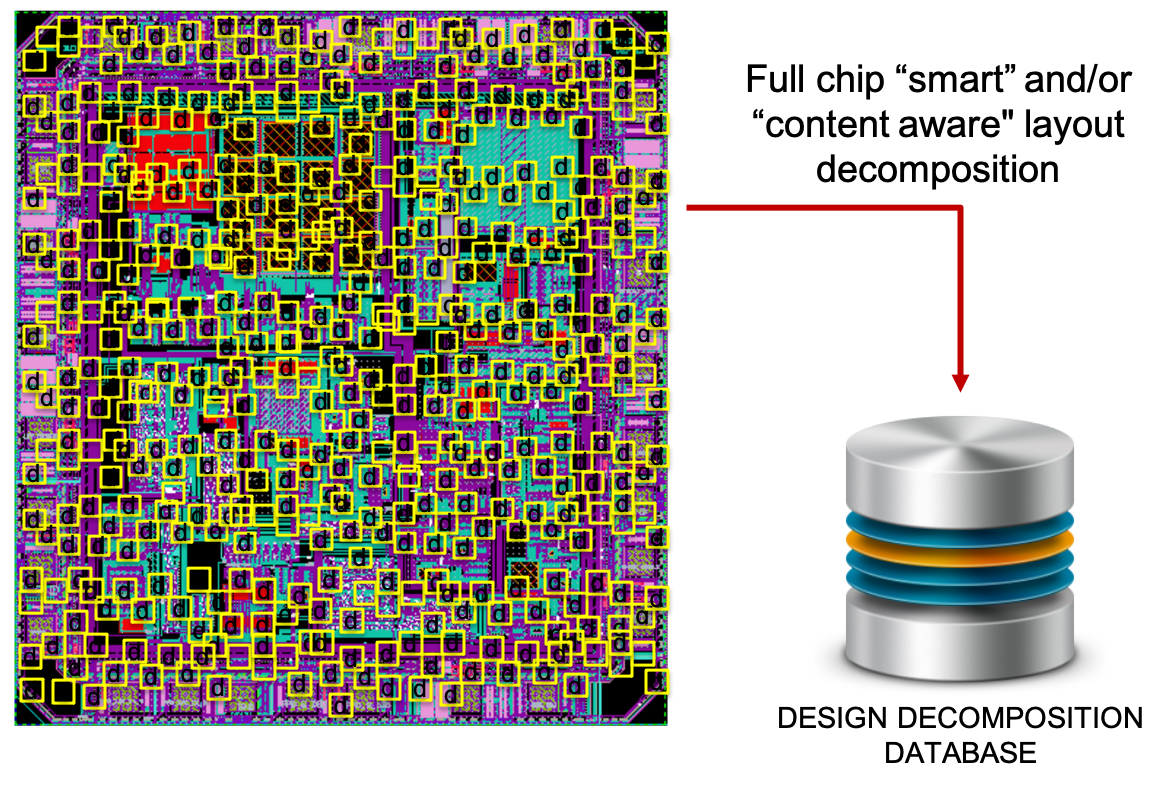
Each layer of interest in the CAD Layout is decomposed systematically into a collection of unique constituent patterns of a specified maximum size. A poly layer, for instance, will be fully decomposed into its unique constituent patterns.
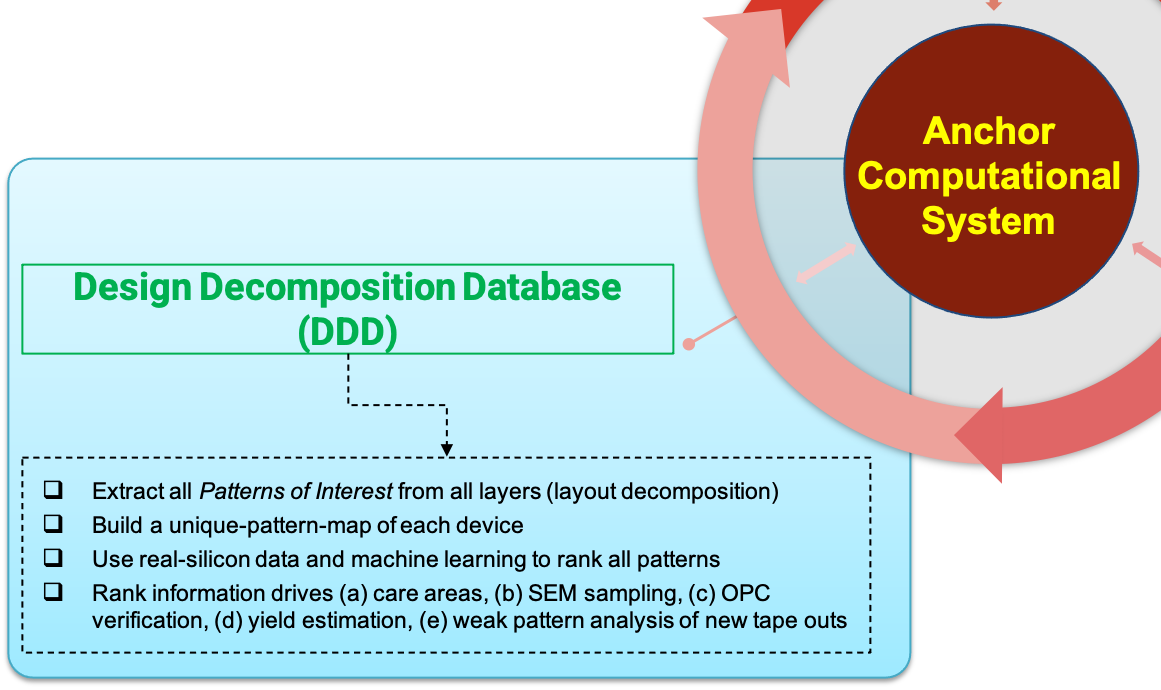
Decomposition is performed using a set of parametric search rules, which means that only patterns of interest are extracted. This eliminates don’t care patterns that would otherwise burden the database with too many nuisance patterns. When a layer is fully decomposed into its constituent patterns of interest, the result is an abbreviated representation of the layer. We call this the Design Decomposition Database.
Parametric search rules can specify both generic line space and line width patterns, or highly specific, but parametrized patterns. An example of a specific but parametrized pattern is a tip-to-line. There can be many variations of tip-to-line depending on the (a) gap between tip and line, (b) width of the tip, (c) width of the line, (d) run length of the tip, (e) run length of the line, etc. All of these [items (a) through (e)] are parameters of the specific pattern known as tip-to-line.
Parametric rules allow us to locate all variations of tip-to-line based on flexible constraints applied to all parameters (a) through (e). Creating such a rule is both intuitive and efficient by using the Parametric Rule Editor.
Pattern Risk Scoring
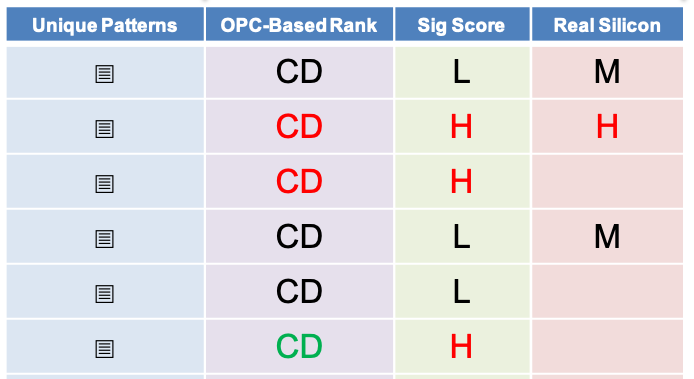
Patterns in the Design Decomposition Database are scored on the basis of any and all available information sources. These include simulation sources such as OPC simulation, statistical or geometrical sources (design signatures), and empirical sources such as pattern fidelity information extracted from real-silicon SEM images.
When all patterns are scored (or ranked), we can:
When all patterns are scored (or ranked), we can:
- Perform data mining to find weakest and strongest patterns.
- Trend Analysis: How do the pattern scores change over time?
- Create optical inspection and E-Beam inspection care areas.
- Perform improved defect sampling for SEM review.
- Provide feedback to OPC / Lithography teams.
Benefit 1:
Apply geometric signatures, simulation results, and empirical data to assess the process marginality or risk of each pattern.
Apply geometric signatures, simulation results, and empirical data to assess the process marginality or risk of each pattern.
Benefit 2:
Compare and contrast a new tape-out against a well-established design to identify risk factors in the new tape-out.
Compare and contrast a new tape-out against a well-established design to identify risk factors in the new tape-out.
Benefit 3:
Apply pattern risk scores when generating care areas for both optical and E-Beam inspection, and SEM review plans.
Apply pattern risk scores when generating care areas for both optical and E-Beam inspection, and SEM review plans.

Technical Requirements
The minimum system requirements are listed below:
Memory and hard drive requirements can vary substantially from customer to customer. Customers who expect to store large quantities of images on the server should allocate appropriate hard drive capacity. Customers who expect to process large numbers of images should allocate additional physical memory. Anchor Semiconductor will help each customer with the appropriate sizing of their hardware.
- Linux 2.6 or later, 64-bit, x86 based processor.
- 16 or more physical cores.
- 128 GB or more physical memory.
- 2 TB or more available hard drive capacity.
Memory and hard drive requirements can vary substantially from customer to customer. Customers who expect to store large quantities of images on the server should allocate appropriate hard drive capacity. Customers who expect to process large numbers of images should allocate additional physical memory. Anchor Semiconductor will help each customer with the appropriate sizing of their hardware.

