PWA: Process Window Analyzer

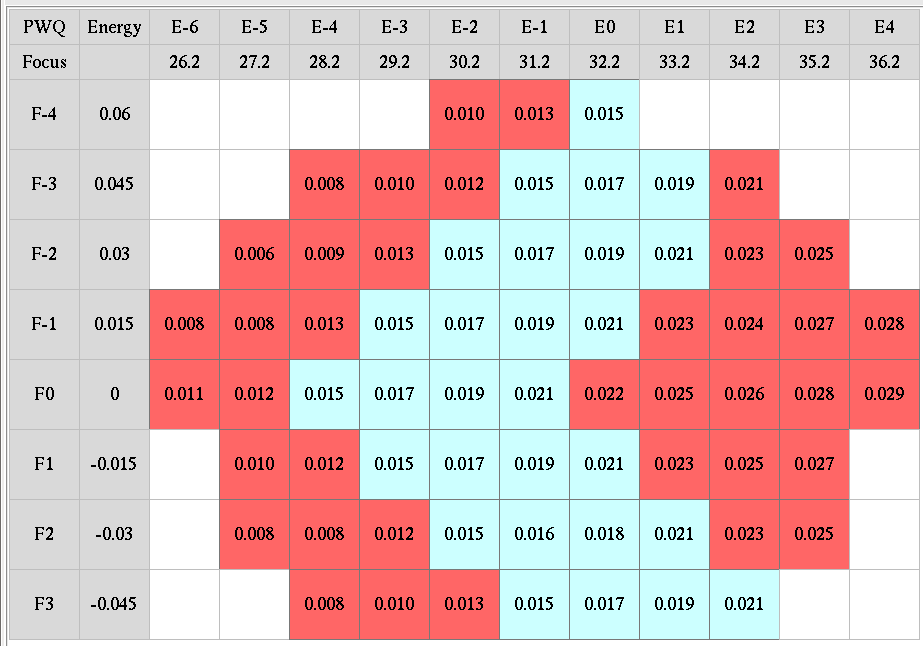
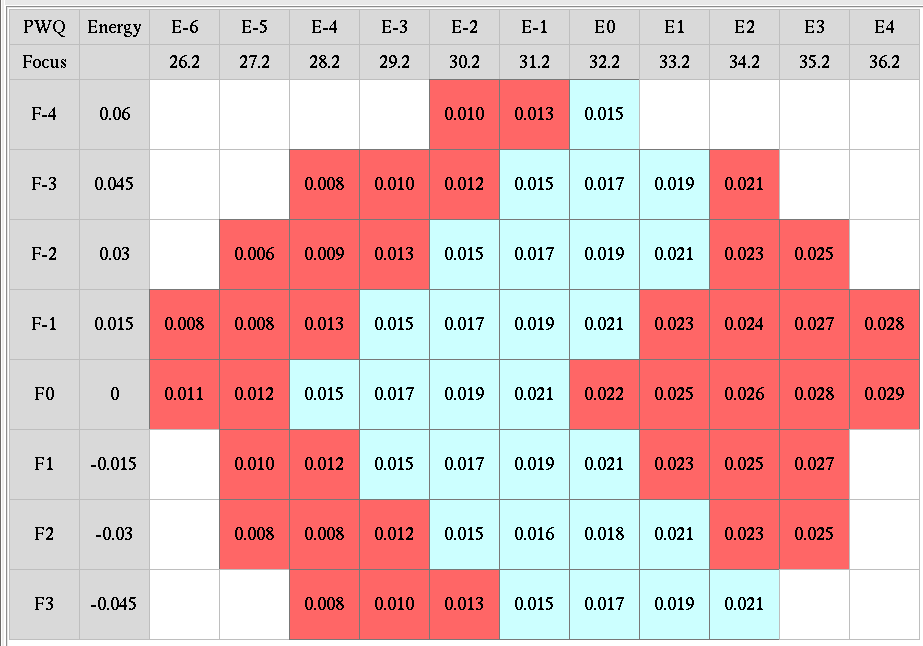
The conventional method of analyzing Focus/Exposure Modulations (FEM) is by performing a high-sensitivity wafer inspection followed by a large SEM Review in which tens of thousands of SEM images are captured and analyzed for the presence of hard defects. The conventional method does not take pattern fidelity into account and therefore cannot track or report the subtle deviations that occur on each pattern across each modulation. Subtle deviations – pattern fidelity variations – are playing an increasingly significant role in parametric yield loss. Establishing a lithography process window that takes into account pattern fidelity (not just pattern defectivity) leads to a more robust result.
Process Window Analyzer
Anchor’s computational system redefines and reinvents FEM/PWQ analysis in the following ways:
The computational system checks every SEM image for the presence of die-to-database defects. Some of these defects are not detectable using conventional die-to-die or die-to-golden die techniques. Multiple defects can be detected on a single image.
The computational system measures every feature of interest in every SEM image (massive metrology) to generate pattern uniformity statistics for each pattern of interest. This enables pattern fidelity analysis.
The computational system tracks the uniformity of like patterns across each modulation to generate Bossung Curves automatically for hundreds or thousands or tens of thousands of patterns. These Bossung Curves supplement – not replace – conventional CD-SEM analysis because accuracy of measurements from Review SEM is limited. Nevertheless, these Bossung Curves are produced more quickly and cover a significantly wider set of patterns. They provide valuable early feedback.
The combination of (a) better defect detection, (b) pattern uniformity/fidelity analysis, and (c) generation of Bossung Curves for a wide set of patterns results in the reinvention of PWQ/FEM analysis.
Benefits:
Automatically locates all patterns-of-interest in all SEM images across all Focus/Exposure modulations (automatic target selection), measures the essential features of those patterns across modulations, and presents the information in flexible ways, including Bossung curves.
By performing this analysis across a wide set of diverse patterns, it becomes possible to study patterning behavior across modulations in a significantly more comprehensive and time-efficient manner.
The knowledge gained from this analysis can be fed back to OPC/Litho and used to establish tighter process windows.

Technical Requirements
The minimum system requirements are listed below:
Memory and hard drive requirements can vary substantially from customer to customer. Customers who expect to store large quantities of images on the server should allocate appropriate hard drive capacity. Customers who expect to process large numbers of images should allocate additional physical memory. Anchor Semiconductor will help each customer with the appropriate sizing of their hardware.
- Linux 2.6 or later, 64-bit, x86 based processor.
- 16 or more physical cores.
- 128 GB or more physical memory.
- 2 TB or more available hard drive capacity.
Memory and hard drive requirements can vary substantially from customer to customer. Customers who expect to store large quantities of images on the server should allocate appropriate hard drive capacity. Customers who expect to process large numbers of images should allocate additional physical memory. Anchor Semiconductor will help each customer with the appropriate sizing of their hardware.
